Analyzing a new market may sound like an overwhelming task. However, like many other challenges, it is not too hard to do. Based on best practices and functionalities of the Semrush Traffic & Market Toolkit, we’ve created a comprehensive guide that will help you analyze a new market in three big steps.
- Step 1. Industry and Market Overview
- Step 2. Target Audience Analysis
- Step 3. In-Depth Competitor Analysis
Step 1. Industry and Market Overview
Before you step into uncharted territory, there are some things to consider. First and foremost, make sure there is any market at all. Look at businesses like yours to estimate their size and composition, note the most visible trends, and outline the market segments to make your further work easier. Among other things, this information can help you persuade investors that you are aware of the environment you are competing in.
Reveal the Key Players
Companies that have already succeeded in the target niche can become your main informants. So, start by identifying key businesses in the industry. To do this, you can type a key player’s domain into the Market Overview dashboard.
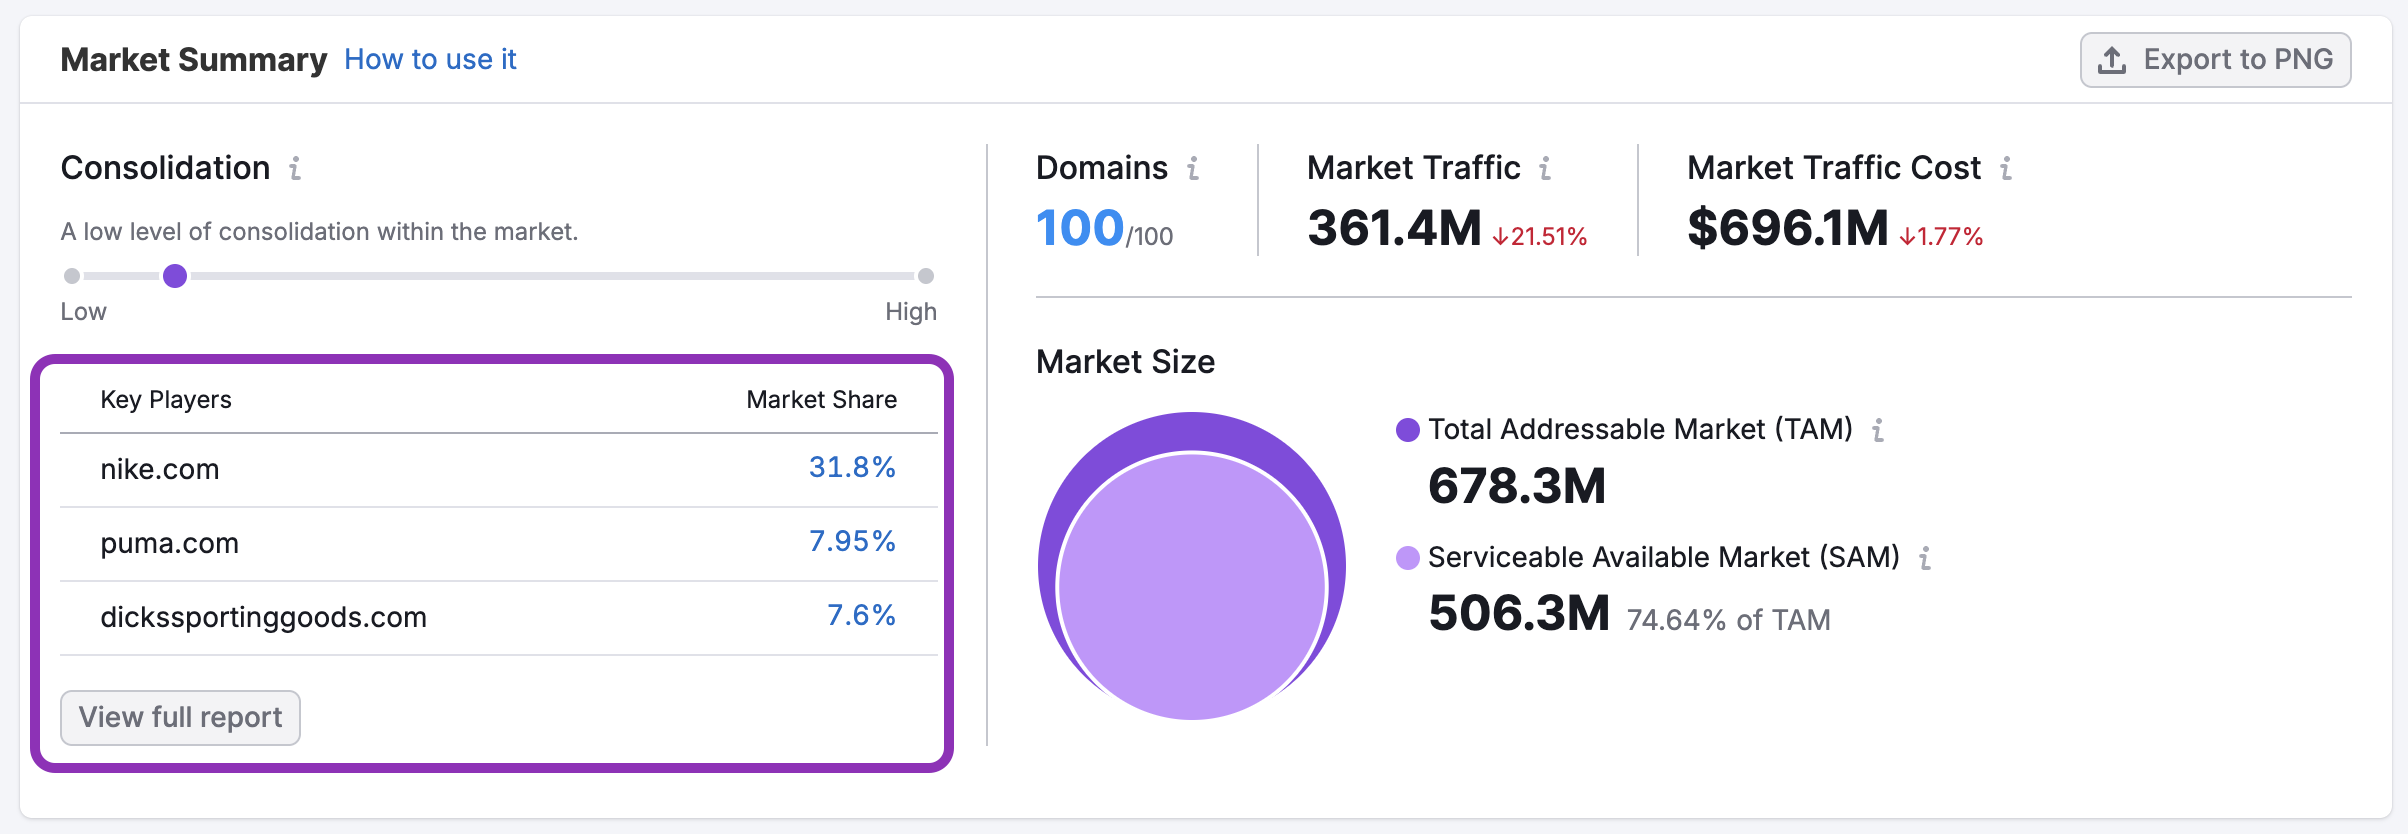
Domains on the top of the list should be of special interest to you. By traffic volume, you can estimate their approximate market shares and make a shortlist of businesses whose strategies you should study closely.
For each of these players, you can reveal audience characteristics, traffic sources, and traffic trends — all with the help of the Semrush Traffic & Market Toolkit.
If you want to view the whole list of market players, simply click the “View full report” button. This will bring you to the Market Players section of the report with a full list.

Here you can compare market share percentages, but you can also benchmark user behavior metrics like visits and bounce rates channel specific traffic metrics.
Make note of these key players. You’ll want to dig deeper into their traffic strategies later in your research. But first, let’s consider general market growth dynamics.
Detect General Market Growth Dynamics
Hopefully, you have found a market that is perfectly balanced, meaning there is competition, and an empty field at the same time. Now, to decrease future risks, it is important to understand whether your target industry/niche is thriving or falling into decline, how big it currently is, and how quickly it is changing. Here, you can stick with the Market Overview dashboard.
The Market Size section comes in handy here—highlighting both the Total Addressable Market (TAM) and the Serviceable Available Market (SAM).

- TAM (Total Addressable Market) represents the absolute maximum demand for your product or service across the entire market.
- SAM (Serviceable Available Market), on the other hand, narrows it down to the part of the market your business can realistically serve.
These figures help you define:
- Whether the market is worth entering based on its current and potential size
- How aggressively to invest in expansion, marketing, and product development
- What slice of the pie is realistically available given your business model or geographic reach
Once you’ve established that the market is healthy and sizable, the next step is to evaluate how individual players are performing relative to one another. That’s where the Growth Quadrant in the Market Overview dashbhorad becomes invaluable.
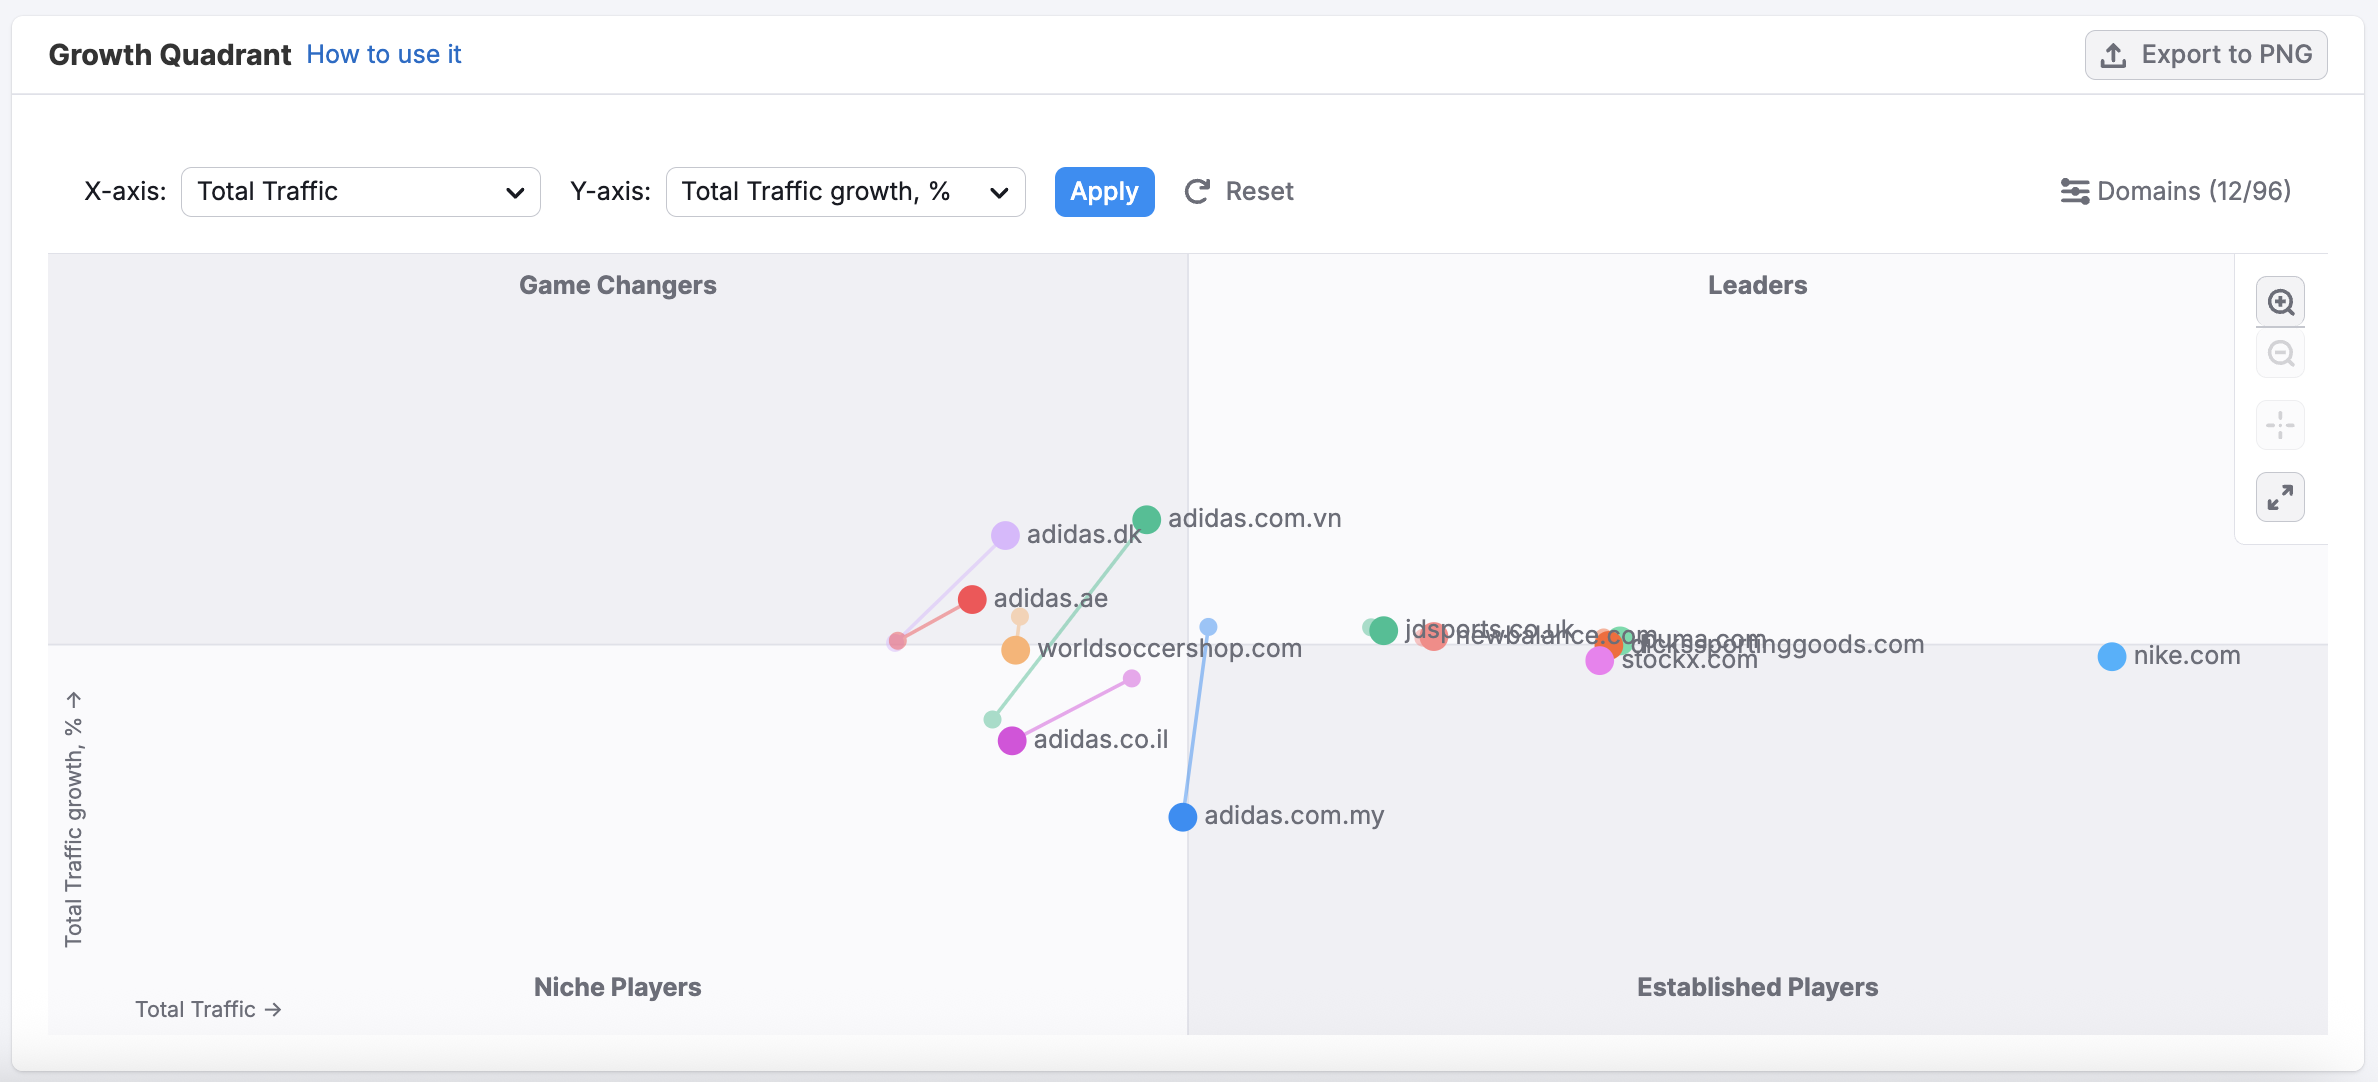
This visual layout allows you to segment competitors into four categories:
- Leaders – These are the dominant players with both high traffic and strong growth. Keep a close eye on their strategies—they’re setting the pace for the market.
- Established Players – Brands with significant market share but slower or negative growth. They may be vulnerable to disruption or shifting consumer preferences.
- Game Changers – Fast-growing newcomers or niche players gaining traction. They may hold the key to emerging trends or unmet audience needs.
- Niche Players – Smaller sites with low traffic and minimal growth. While less threatening, some could represent future disruptors or specialized competitors.
Using the Growth Quadrant, you can:
- Quickly spot rising stars worth monitoring
- Identify underperforming rivals and learn from their missteps
- Benchmark your own growth path against industry trends
Together with the market size and consolidation insights, this quadrant gives you a snapshot of who’s winning, who’s rising, and who’s falling behind.
Outline the Product Offer and Business Development Direction
To create an effective business plan, collect more data on the core products/services they are offering, the business models they are using, and the stage of company development. For this, analyze primary sources, such as companies’ official websites and social media profiles, as well as authoritative industry reports and stats.
This information will help you understand the volume of similar goods and services that are sold in your market right now and make predictions. To speed up the process, you can use news aggregators and content analyzers, like Feedly. If you crave business information, such as revenue, investments, and the number of employees, go to platforms like Crunchbase and Craft.
Take Threats Into Account
Next, try to figure out if there is a threat of new entrants or substitute products/services. Remember that at this stage, you are painting the competitive landscape in large strokes, so you don’t have to dive deep into social mentions and press releases. Just find out if there are any easily accessible gaps in the product — if there is one, you can bet that sooner or later a competitor will fill it.
Highlight the Barriers to Entry
There are high chances, though, that your niche will happen to be empty. This can especially be the case if you’re looking at a new geographical market. Ask yourself: why are global players not active in this particular region yet? The answer may lie in political risks, an unstable economy or volatile market situation. Emerging countries may sound like a profitable option sometimes, but consumer habits there may turn out to be too particular. Other barriers to keep in mind include expenses of language localization, online/offline preferences, and restricted payment and delivery solutions.
Now that you are familiar with the market situation from a businesses’ point of view, you can take a closer look at consumers and their needs and interests in detail.
Step 2. Target Audience Analysis
Understanding your potential customers is essential when entering a new market. It’s not just about how many people are out there—it’s about who they are, what they care about, and how you can reach them effectively. The more accurately you define your target audience, the better you can tailor your product positioning, messaging, and campaigns.
The Demographics dashboard helps you answer fundamental questions about who your audience is. You can view and compare the age, gender across domains in your target market.
This gives you a reliable foundation for building accurate personas based on actual user behavior—not just assumptions.
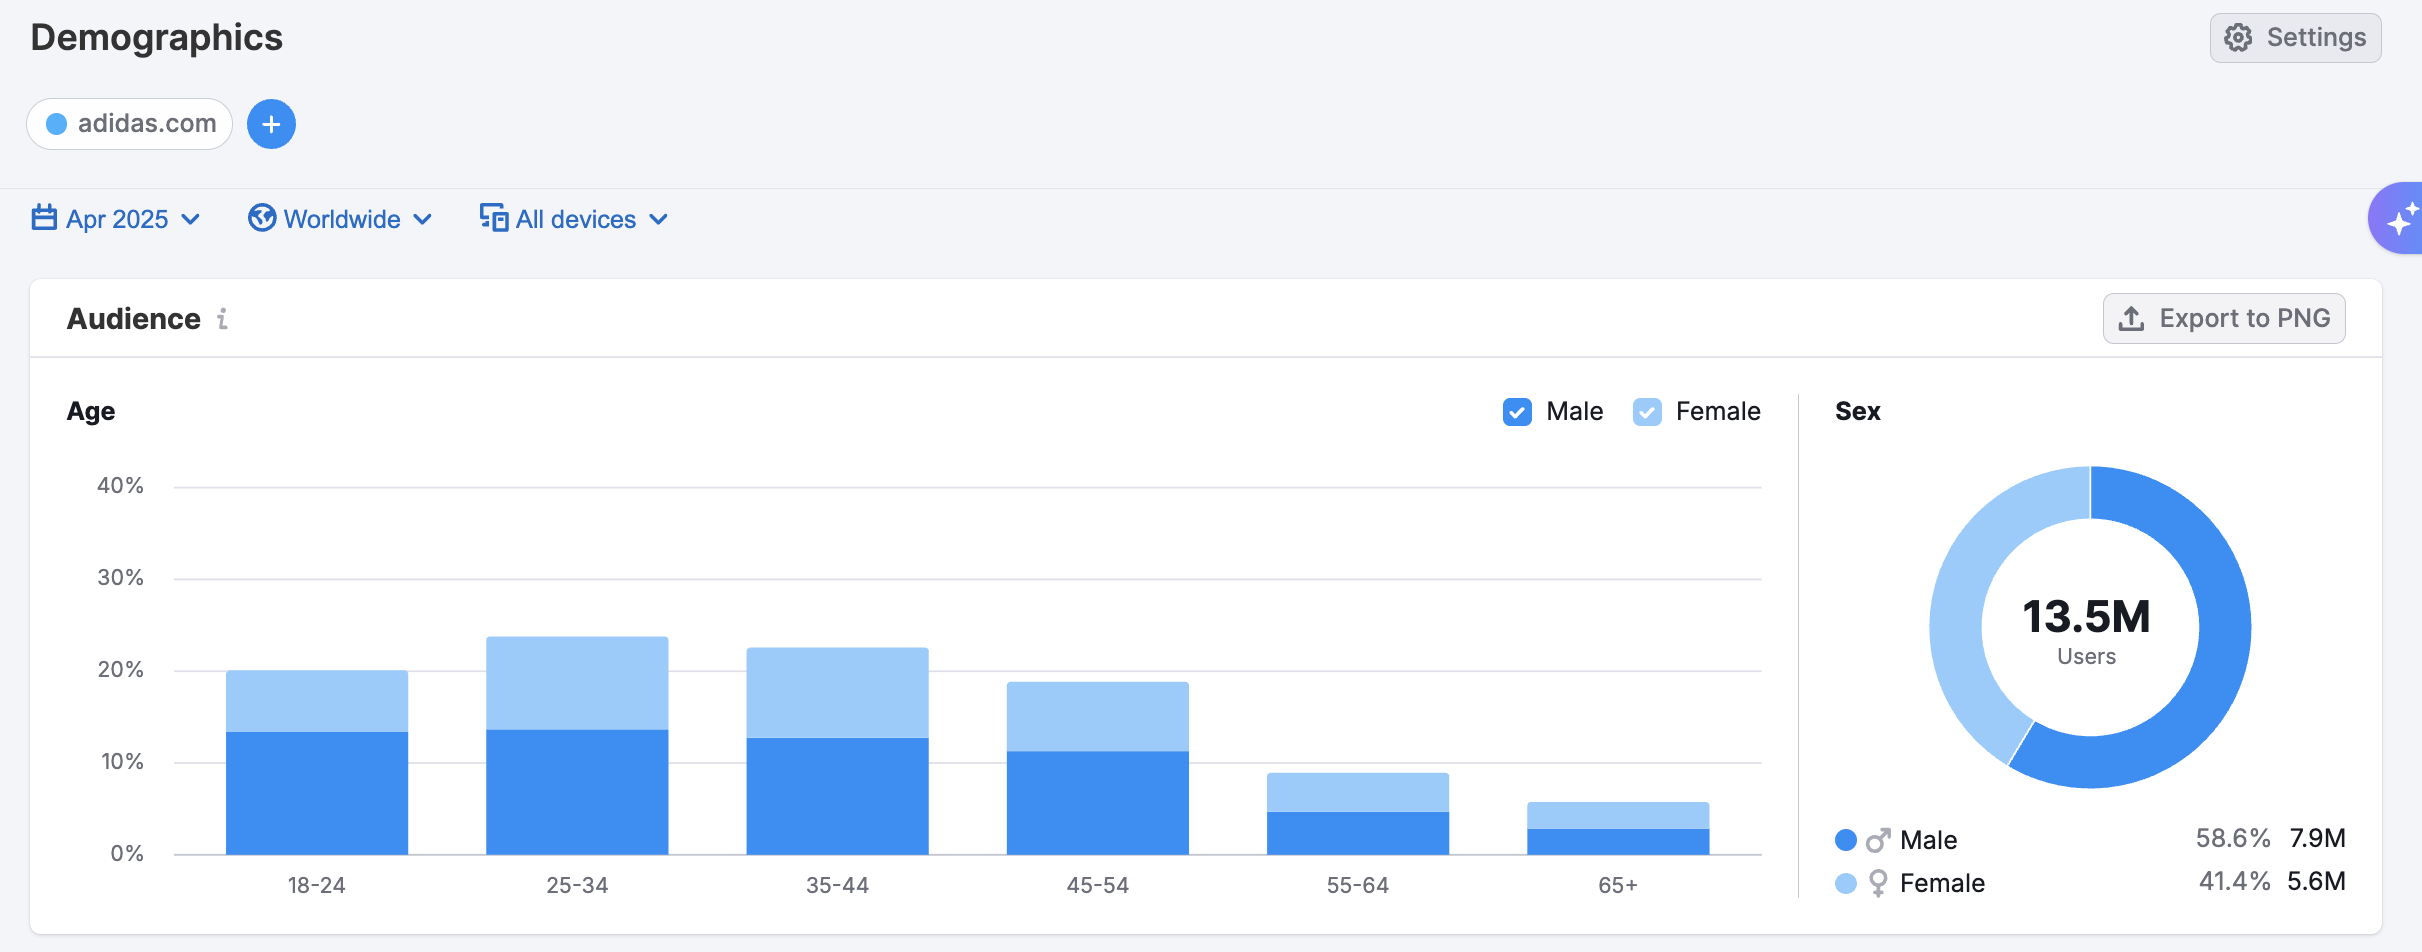
For example:
- A younger, mobile-first audience may require a different UX and ad strategy than an older, more traditional demographic.
- A more mature audience with a higher income might respond better to premium branding, while a broader income spread could point to tiered offerings.
This data can help shape everything from product features to creative direction.
Once you’ve identified a few key competitors or adjacent brands in the market, the Audience Overlap dashboard shows you how much their audiences intersect. This is especially useful for identifying:
- Shared interest pools you can tap into
- White space opportunities where there’s little audience overlap
- Potential partners or threats based on similar audience profiles
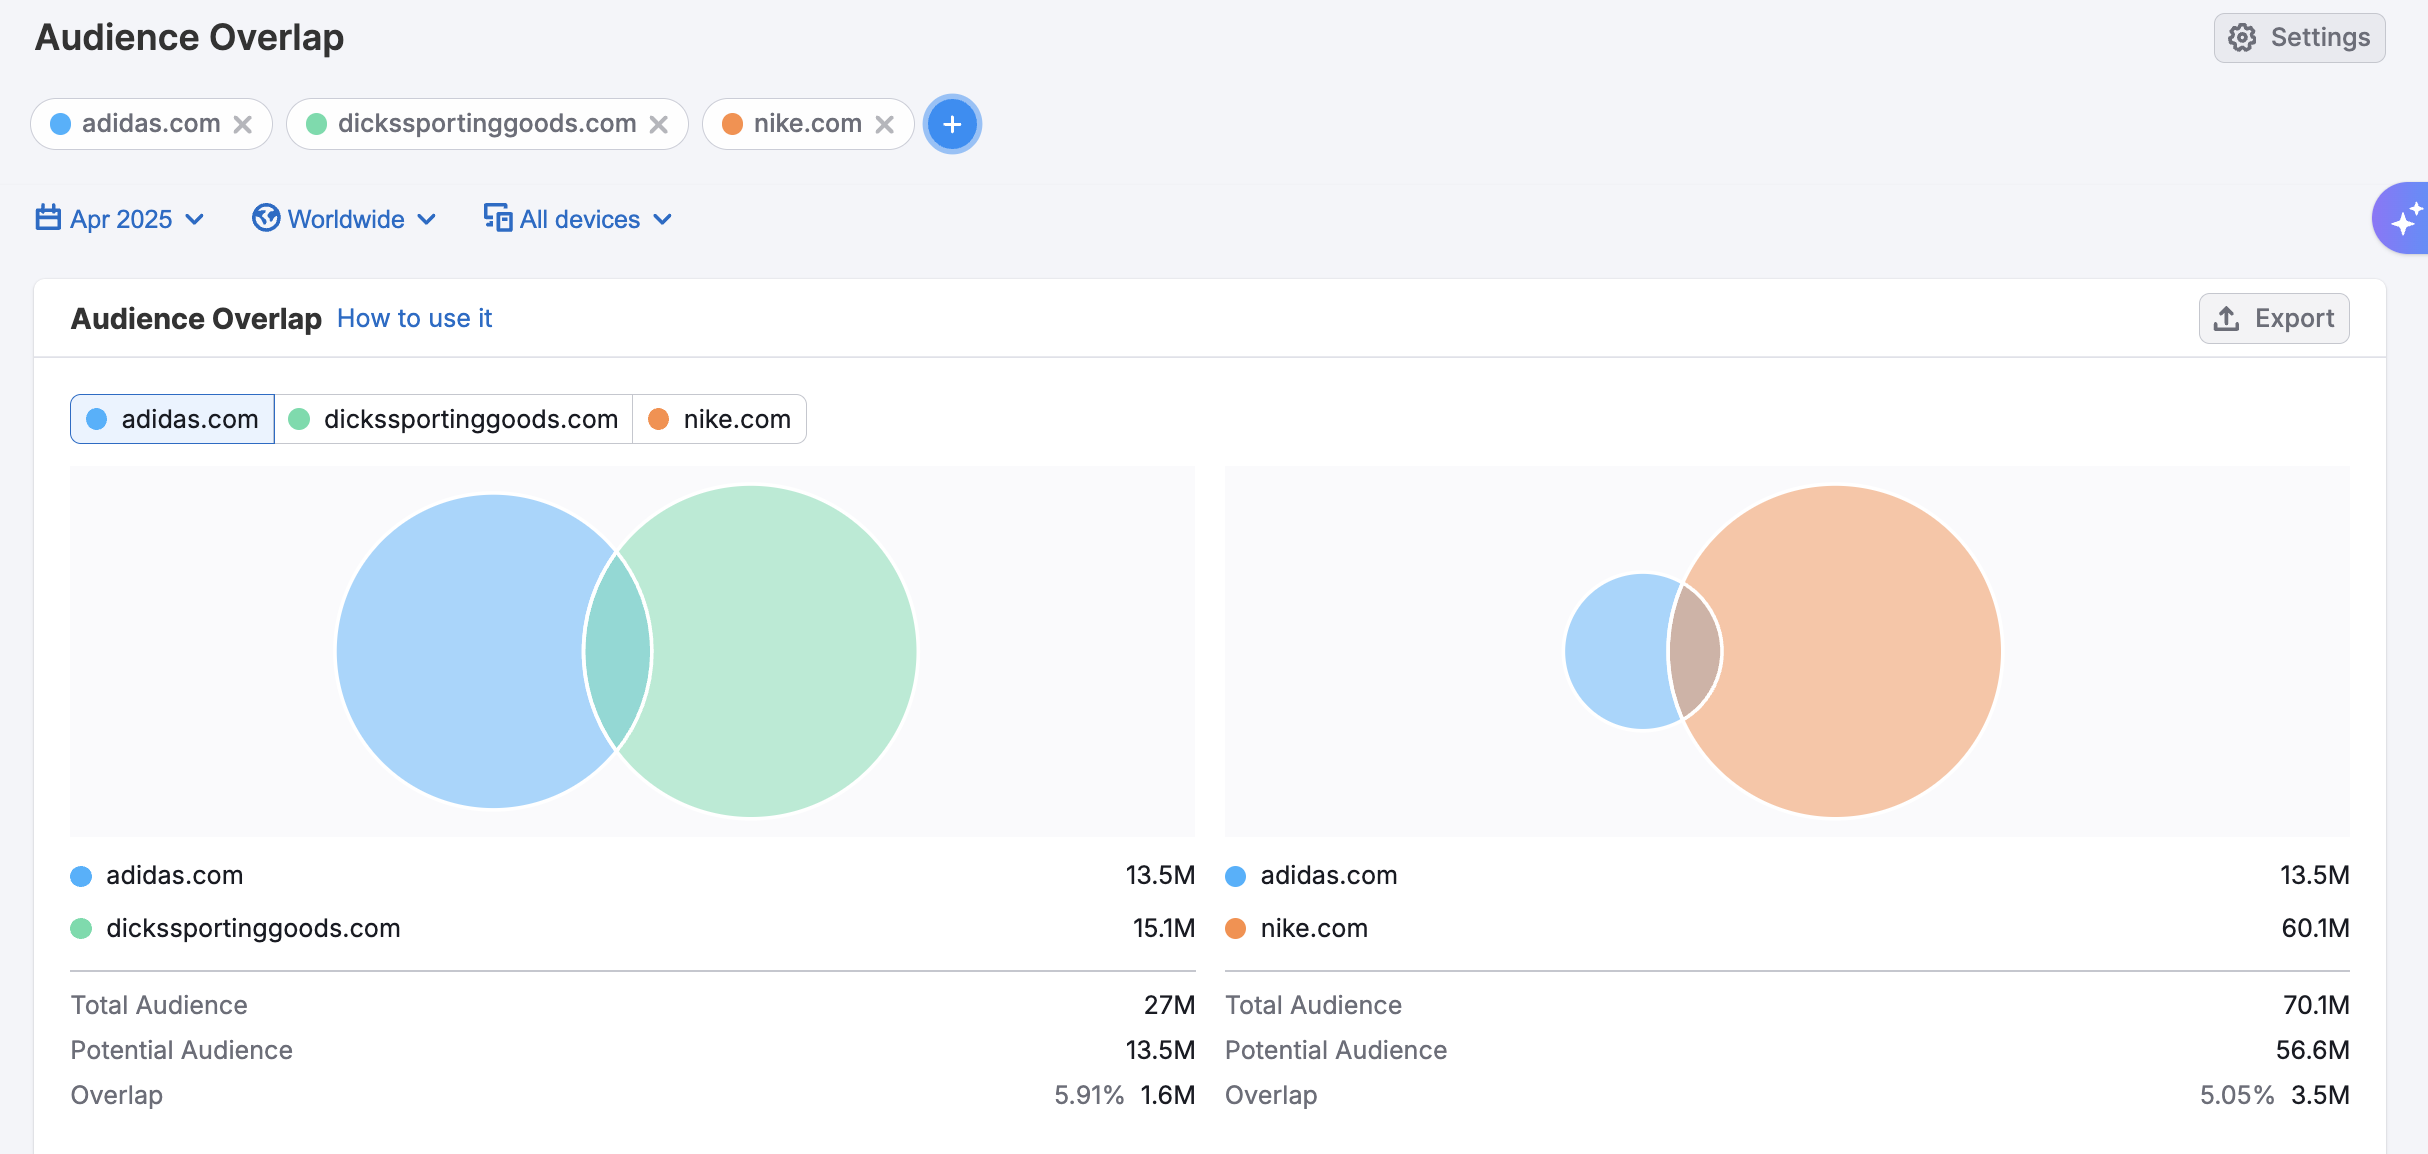
By understanding how audiences are distributed across key players, you can make informed decisions about positioning, partnerships, and competitive targeting.
Estimate the Potential of the Location
Targeting a new location may turn out to be risky due to seasonal demand fluctuations, cultural differences, and variations in consumer behavior. For example, while Western ecommerce markets often see sharp traffic spikes in November and December due to holiday shopping, Eastern markets may show steadier patterns during the same period—driven by entirely different holiday calendars and buying cycles. And that’s just one illustration of how timing, culture, and demand can vary dramatically by region.
To reduce risk and make smarter decisions, you can follow two key approaches. First, identify the regions where your competitors already operate—and especially where they perform best. This gives you a solid starting point for shortlisting markets with proven demand and active audiences.
Check the USA dashboard to get a high-level overview of traffic trends, audience behavior, and potential market saturation within one of the largest ecommerce markets in the world.

For global trends, explore the Countries dashboard to compare traffic performance across markets. You’ll spot key growth regions, declining markets, and unexpected pockets of opportunity.

If you already have a specific country in mind, scroll down to the Traffic by Country table. It breaks down incoming traffic by region, helping you assess the strength of demand and your potential reach in each market.
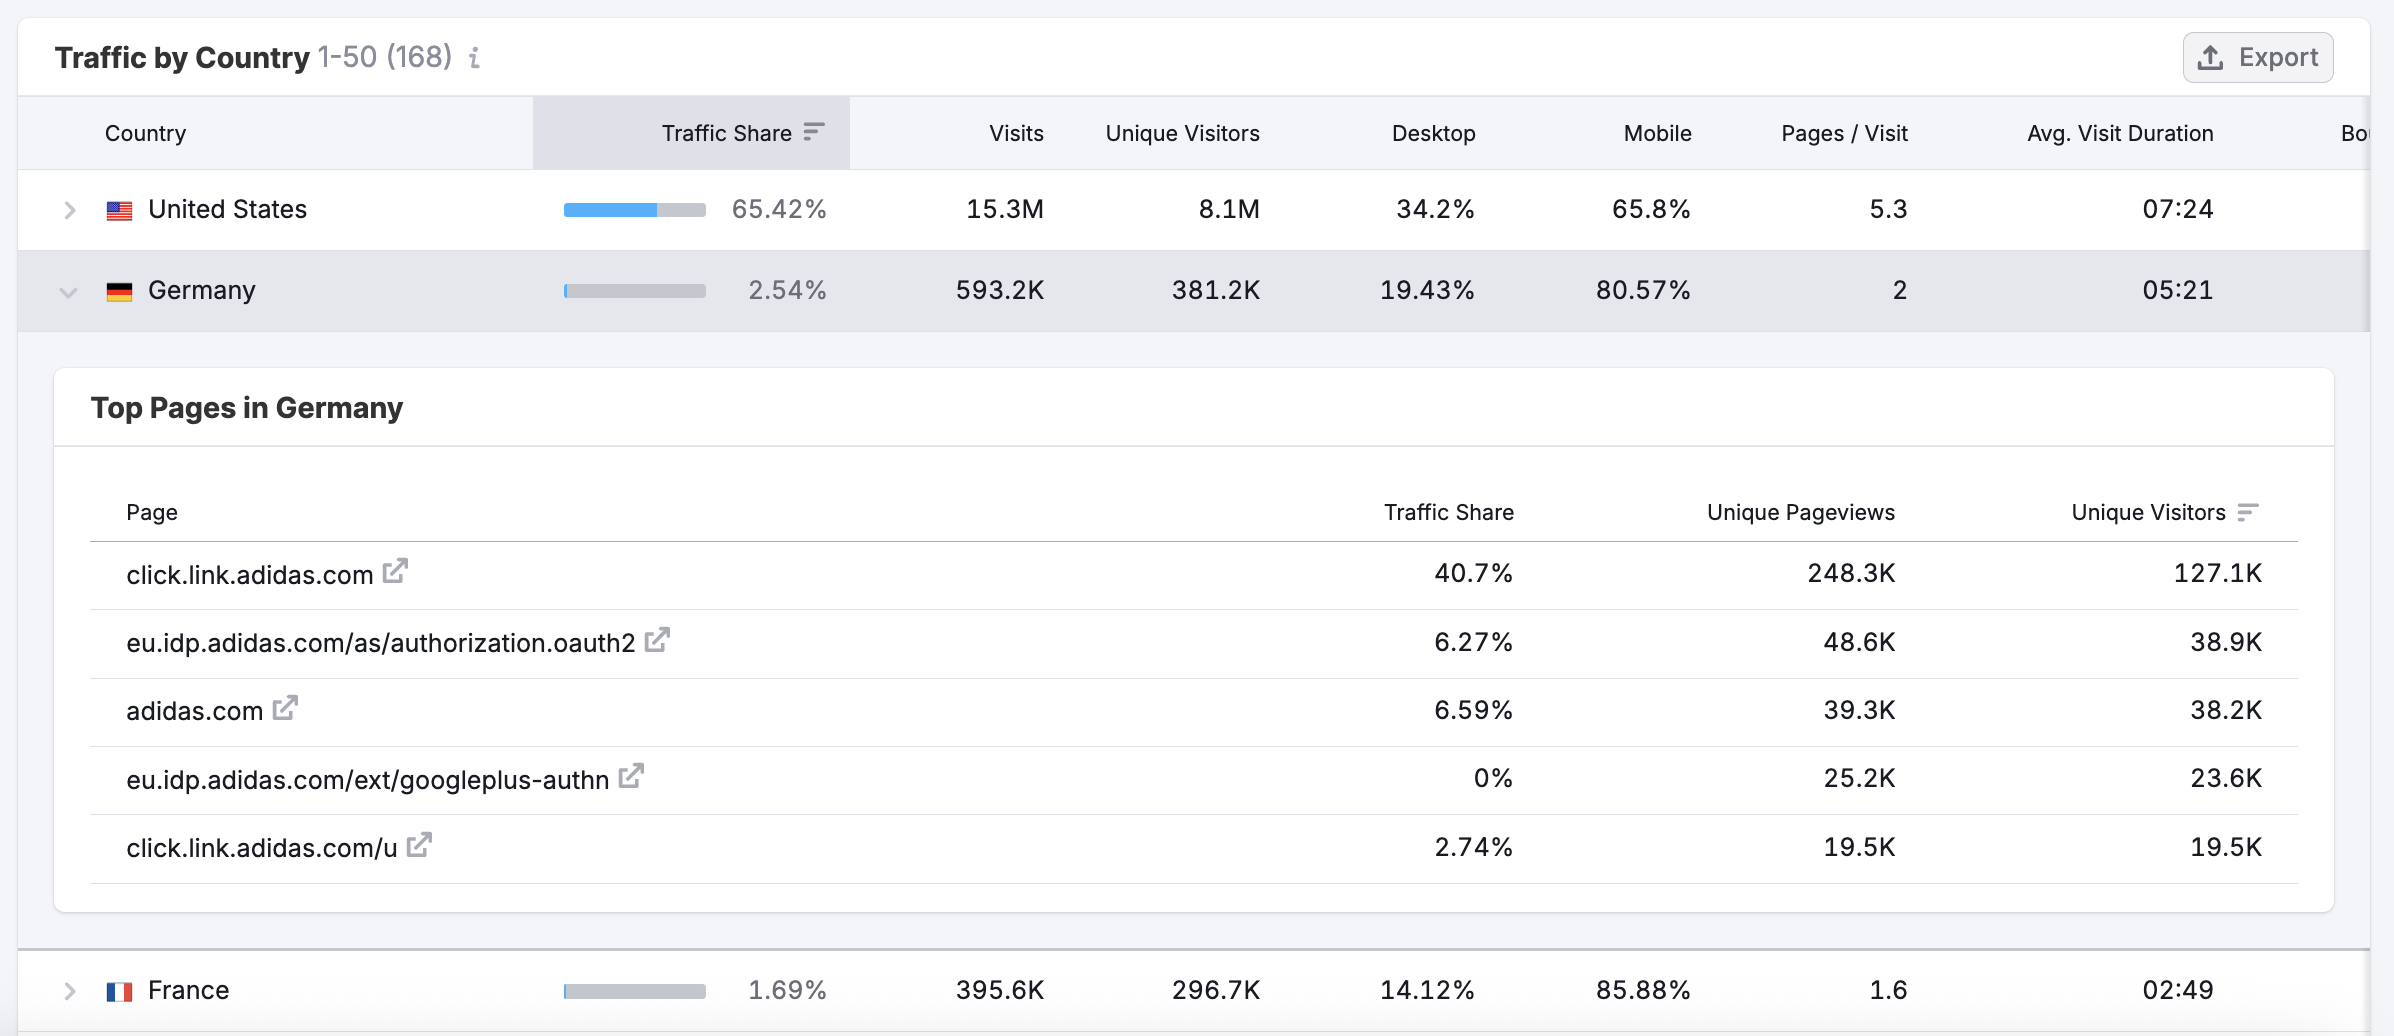
Taken together, these insights allow you to segment the market into clear consumer clusters—making it easier to tailor your strategy, content, and campaigns for each regional opportunity.
Step 3. In-Depth Competitor Analysis
The more details you learn about your competitors’ product marketing, the easier it will be to gain an advantage. Start by analyzing your direct competition, then switch to those who offer alternative solutions.
Proceed from the consumer’s problem your product/service helps to fix; your closest rivals may belong to a different category and offer something less innovative, but engage well with the audience and pose a real threat in marketing.
Analyze Their Marketing Strategies
Wtart with the Traffic Overview dashboard to get a high-level snapshot of your competitor’s online performance. This view reveals total visits, visit trends over time, user engagement metrics like average visit duration purchase conversion metrics, bounce rate, and more. It helps you quickly assess which competitors are gaining traction—and which may be losing ground.

Use the Traffic Channel Trend graph to understand your competitors’ strategies. Looking at shifts in trends by channel can reveal where they’re investing and what channels are producing the best results for them.

Once you understand their overall performance and strategy, you can dive deeper into their product offerings.
Carry Out Product Research
Understanding why consumers choose a competitor’s product can help you refine your own offer. Start by identifying which parts of their site attract the most attention using the Top Pages dashboard.

This view shows you the exact pages driving the most traffic—whether it’s pricing, product listings, blog content, or specific landing pages.
Use this insight to answer key questions like:
- Why do people need this type of product or service in general?
- Why are they buying it from this particular company?
- Why do I believe my brand can compete—and win?
Next, step into the customer’s shoes. Sign up for a trial, purchase a product, or contact their support team. Evaluate the experience based on:
- What features or benefits are included
- Pricing structure and ease of purchase
- Onboarding flow and usability
- Customer service responsiveness
- Communication style (newsletters, follow-ups, etc.)
- How well the product actually solves the problem
- Any weaknesses or opportunities for improvement
Cross-reference these observations with the top-performing pages. For example, if a competitor’s pricing or “How it works” page brings in a large share of traffic, those areas are likely central to their conversion strategy—and worth analyzing closely.
Finally, document how your offer compares. You don’t always need to reinvent the wheel—sometimes a clear point of difference is all it takes to win attention and market share.
Map Out Traffic Flow with the Sources & Destinations Data
Finally, use the Sources & Destinations dashboard to explore:
- Where their traffic is coming from (top referring sites and channels)
- Where visitors go after leaving (which may hint at partnerships, marketplaces, or review platforms)
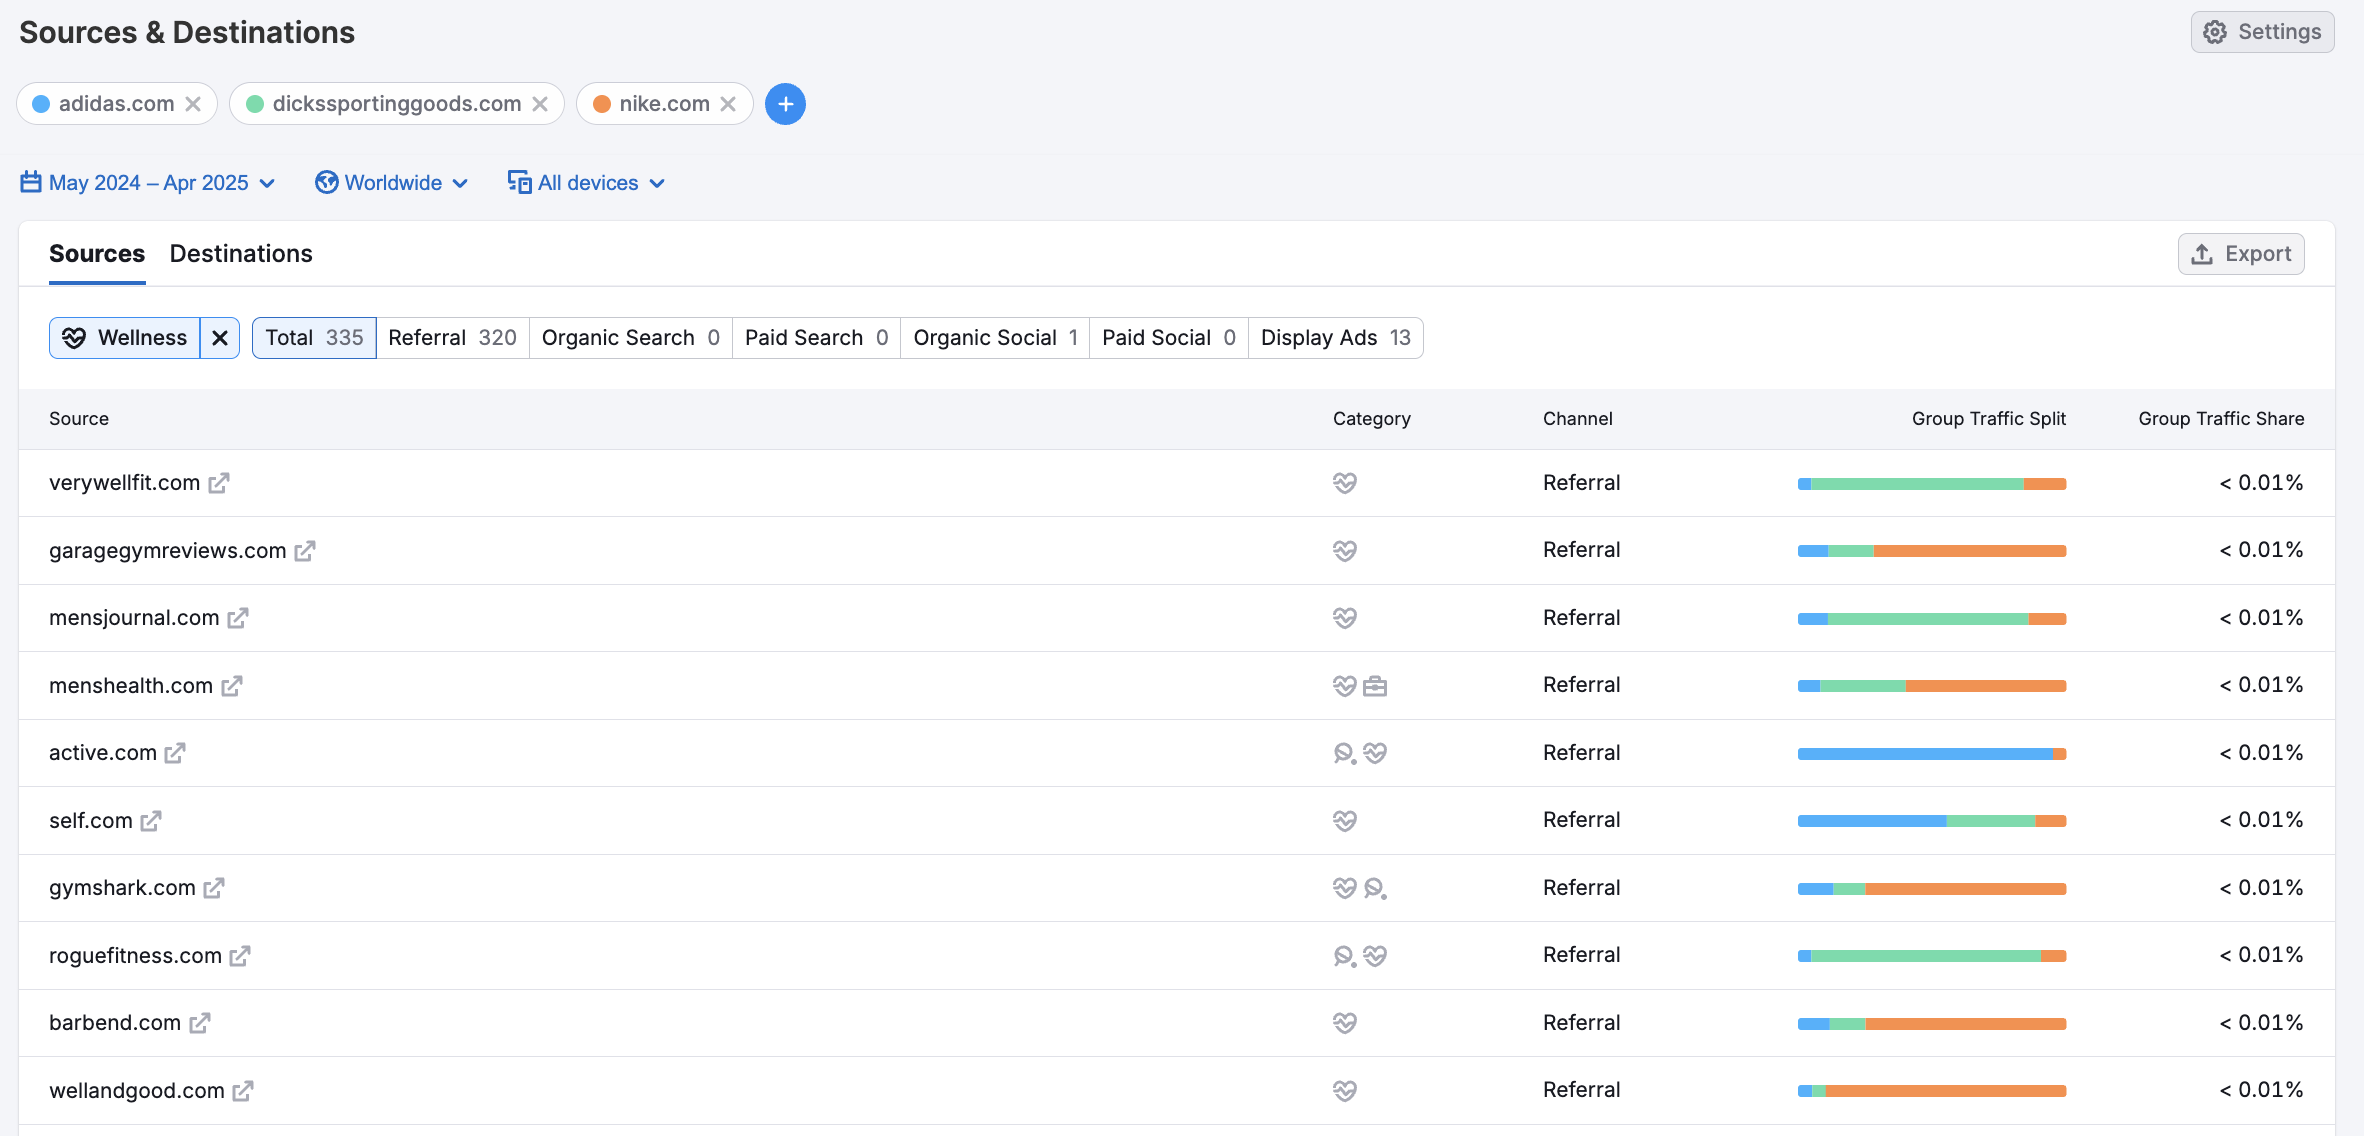
Understanding these behaviors can guide your decisions on where to promote, which traffic channels to test, and where to potentially partner or advertise.
Concluding Remarks and Last-Minute Advice
This market analysis guide is designed to answer any business needs. However, you can follow its steps as separate instructions at different stages of your research or add more Semrush tools from the Semrush Traffic & Market Toolkit at each step to customize the guide for your own needs. A larger dataset will never hurt — remember that competitive intelligence is to inform, not to determine your roadmap.


